决策树(decision tree)
决策树模型呈树形结构,在分类问题中,表示基于特征对实例进行分类的过程,它可以认为是if-then规则的集合,也可以认为是定义在特征空间与类空间上的条件概率分布.
决策树的构造
常用的算法是ID3, C4.5和CART算法.这里使用ID3算法
信息增益
在划分数据集之前之后信息发生的变化称为信息增益.信息增益最高的特征为最好的选择.ID3算法使用信息增益信息构造决策树,C4.5使用信息增益比.
计算香农熵(简称熵)
1 | from math import log |
数据集
1 | def createDataSet(): |
1 | myDat, labels = createDataSet() |
[[1, 1, 'yes'], [1, 1, 'yes'], [1, 0, 'no'], [0, 1, 'no'], [0, 1, 'no']]
1 | calShannonEnt(myDat) |
0.9709505944546686
1 | myDat[0][-1] = 'maybe' |
[[1, 1, 'maybe'], [1, 1, 'yes'], [1, 0, 'no'], [0, 1, 'no'], [0, 1, 'no']]
1 | calShannonEnt(myDat) |
1.3709505944546687
划分数据集
按照给定特征划分数据集
1 | def splitDataSet(dataSet, axis, value): |
这里使用的是retDataSet.append(featVec[:]),简化了书中的代码.
Python语言不考虑内存分配的问题,Python语言在函数中传递的是列表的引用,在函数内部修改对列表的引用,将会影响该列表对象的整个生存周期,例子如下:
1 | def test(a, b): |
1 | a=[1,2,3] |
[1, 2, 3]
[4, 'test', 6]
可见a变了,而b没变
1 | myDat, labels = createDataSet() |
[[1, 1, 'yes'], [1, 1, 'yes'], [1, 0, 'no'], [0, 1, 'no'], [0, 1, 'no']]
1 | splitDataSet(myDat,0, 1) |
[[1, 'yes'], [1, 'yes'], [0, 'no']]
1 | splitDataSet(myDat,0, 0) |
[[1, 'no'], [1, 'no']]
选择最好的数据划分方式
1 | def chooseBestFeatureToSplit(dataSet): |
1 | chooseBestFeatureToSplit(myDat) |
0
1 | myDat |
[[1, 1, 'yes'], [1, 1, 'yes'], [1, 0, 'no'], [0, 1, 'no'], [0, 1, 'no']]
递归构建决策树
多数表决
1 | def majorityCnt(classList): |
创建树
1 | def createTree(dataSet, labels): |
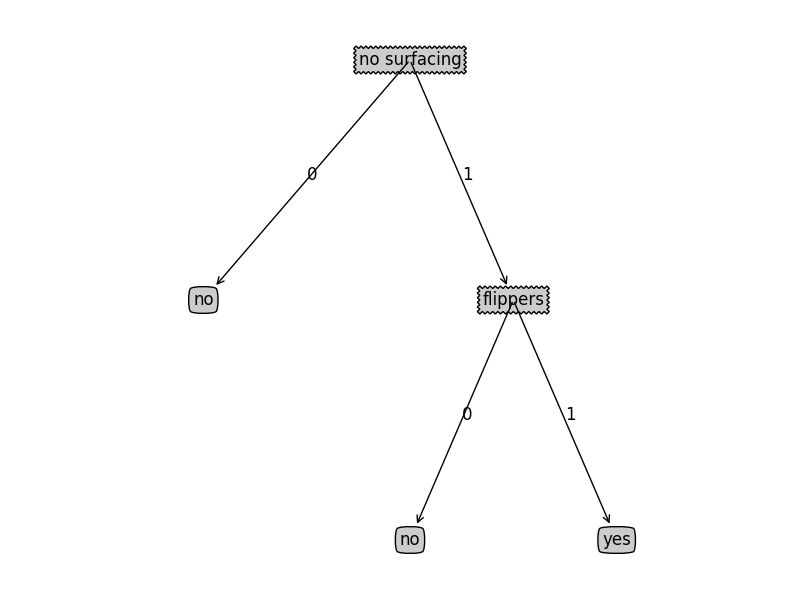
1 | myDat, labels = createDataSet() |
1 | myTree |
{'no surfacing': {0: 'no', 1: {'flippers': {0: 'no', 1: 'yes'}}}}
在Python中使用Matplotlib绘制树形图
Matplotlib注解
使用文本注解绘制树节点
1 | import matplotlib.pyplot as plt |
1 | createPlot() |

构造注释解
获取叶节点的数目和树的层数
1 | def getNumLeafs(myTree): |
1 | getNumLeafs(retrieveTree(0)) |
3
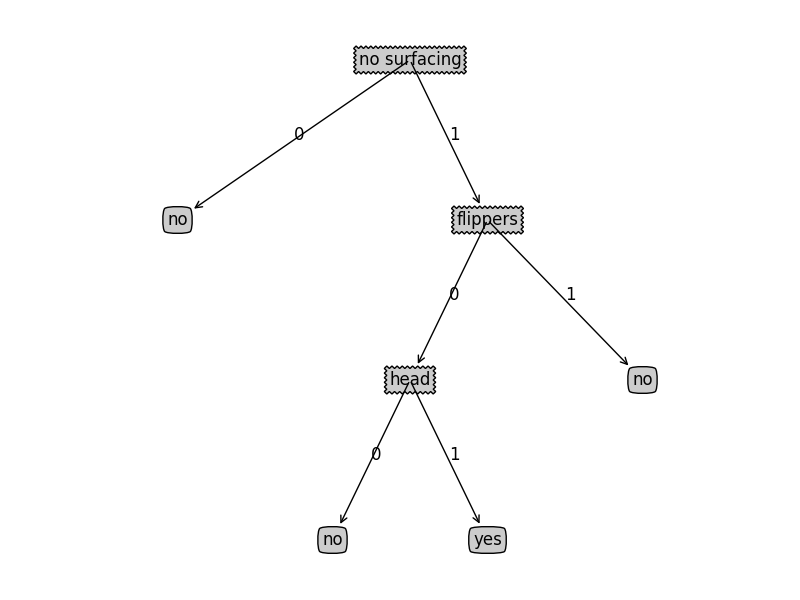
1 | getNumLeafs(retrieveTree(1)) |
4
1 | getTreeDepth(retrieveTree(0)) |
2
1 | getTreeDepth(retrieveTree(1)) |
3
绘制树
1 | #在父子节点间填充文本消息 |
1 | createPlot(retrieveTree(0)) |
1 | createPlot(retrieveTree(1)) |
测试和存储分类器
测试算法 : 使用决策树执行分类
1 | def classify(inputTree, featLabels, testVec): |
1 | myDat, labels = createDataSet() |
1 | myTree = retrieveTree(0) |
1 | classify(myTree, labels, [1,1]) |
'yes'
使用算法: 决策树的存储
使用pickle模块存储决策树
1 | def storeTree(inputTree, filename): |
1 | storeTree(myTree, 'test.txt') |
1 | grabTree('test.txt') |
{'no surfacing': {0: 'no', 1: {'flippers': {0: 'no', 1: 'yes'}}}}
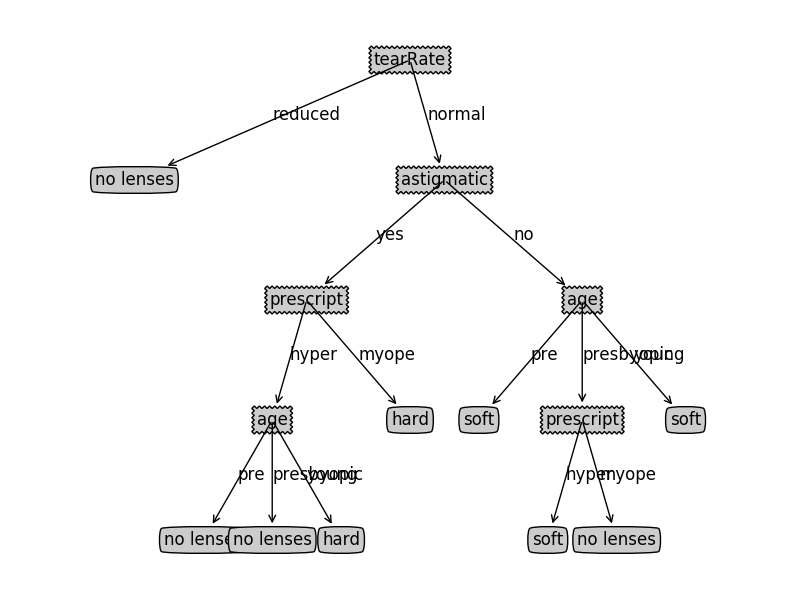
使用决策树预测隐形眼睛类型
1 | fr = open('lenses.txt') |
1 | lensesLabels = ['age', 'prescript', 'astigmatic', 'tearRate'] |
1 | lensesTree |
{'tearRate': {'normal': {'astigmatic': {'no': {'age': {'pre': 'soft',
      'presbyopic': {'prescript': {'hyper': 'soft', 'myope': 'no lenses'}},
      'young': 'soft'}},
    'yes': {'prescript': {'hyper': {'age': {'pre': 'no lenses',
        'presbyopic': 'no lenses',
        'young': 'hard'}},
      'myope': 'hard'}}}},
  'reduced': 'no lenses'}}
1 | createPlot(lensesTree) |